What is a Good Retention Rate for a Private SaaS Company in 2025?

As we have noted for many years, revenue retention is one of the most important metrics for ensuring medium- to long-term business health due to its compounding effect on growth. The relationship of new sale bookings to revenue retention is the SaaS version of “offense wins games, defense wins championships.”
Measuring key metrics over time offers insight into how a company is evolving. It’s also essential to benchmark metrics against peers to understand what’s “normal” and gauge the potential impact of the macro environment. And for private SaaS companies, benchmarking retention against public SaaS companies is of limited usefulness. The sheer scale of public companies makes for an apples-to-oranges comparison to smaller, private companies that may prove misleading or distracting. To solve for this information gap, we started conducting our annual survey more than a decade ago to help scale-up-sized, private companies better understand how their performance compares to that of their peers.1
For example, if a company with an Average Annual Contract Value (ACV) of $30,000 “only” increased Net Revenue Retention (NRR) from 111% to 112%, there might be concerns that more needed to be done. However, as the data below shows, the median NRR for companies with ACVs of $25,000 to $50,000 is 102%. So, while the absolute change in NRR was small, the company is in the 75th percentile of its peers so it’s already well-optimized.
Before we get into the current SaaS retention benchmarks, it is important to understand the metrics and how they are calculated.
Retention Definitions – Retention or Churn?
Retention is, of course, the glass-half-full cousin of “churn,” the enemy of all SaaS businesses. In the numbers that follow, churn is usually best described as (1 – “gross retention”), meaning, if you have 95% gross retention, that equals 5% churn. Net retention, in turn, adds to gross retention the positive effect of upsells, so net retention is always higher than gross retention. And, the means of calculation should follow a cohort over time for consistency.
How to Calculate Net Revenue Retention
In our survey, we asked companies to report their net and gross annual revenue retention data. Customer account retention may be a useful metric for you to track, but our focus in the survey, and generally the retention metric we think is the most important, is based on dollars of revenue. We define net retention as:
(Monthly Recurring Revenue in December of 2024 only from customers who were customers in December 2023)
÷
(Total MRR in December 2023)
NRR can be anything from 0% to well above 100%, as it includes upsells, new product cross-sells, and price increases.
How to Calculate Gross Revenue Retention
GRR is the same formula, excluding the upsells, cross-sells, and price increases. (For easy calculation, set each customer’s 2024 MRR to be less than or equal to their 2023 MRR.) For this reason, gross retention cannot exceed 100%.
2025 SaaS Retention Benchmarks for Private B2B Companies
For retention, benchmarking by ACV is the best starting point. More than by company age, revenue level, or industry, companies that share a similar selling price have the most in common. They will be organized similarly, go to market similarly, and support customers similarly. The opposite is true of two companies selling a $19.99/month product versus a $250,000/year product. The chart below shows that higher net retention correlates with higher ACVs. The chart below shows median NRR and median GRR across a range of annual contract values (ACVs).
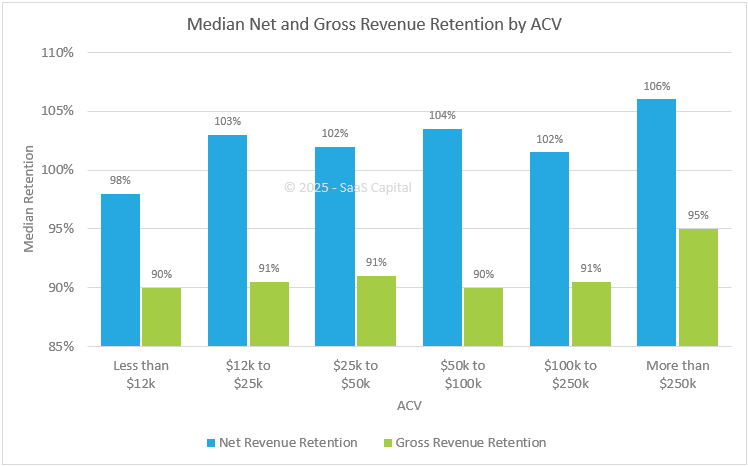
The key takeaway is that higher net retention correlates with higher ACVs. The relationship between ACV and GRR is more nuanced. Companies with the very highest ACVs have the highest gross retention. This relationship makes intuitive sense. Higher-priced solutions often involve a longer sales cycle, in-depth scoping and implementation, and dedicated support and account management, all of which yield a stickier product.
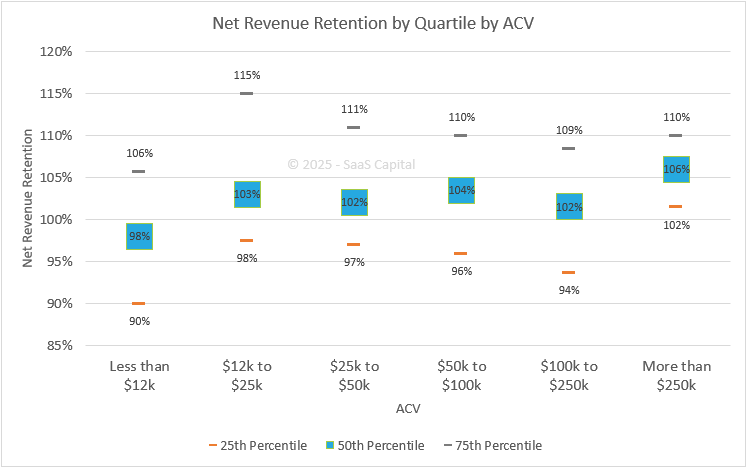
Net Revenue Retention Quartiles
Digging deeper into the net revenue benchmarks, the chart below shows NRR broken into quartiles for the same ACV categories. For example, companies with ACVs between $25,000 and $50,000 show a median net revenue retention of 102% with the top quartile reporting NRR of 111% and the lowest quartile reporting 97% NRR.
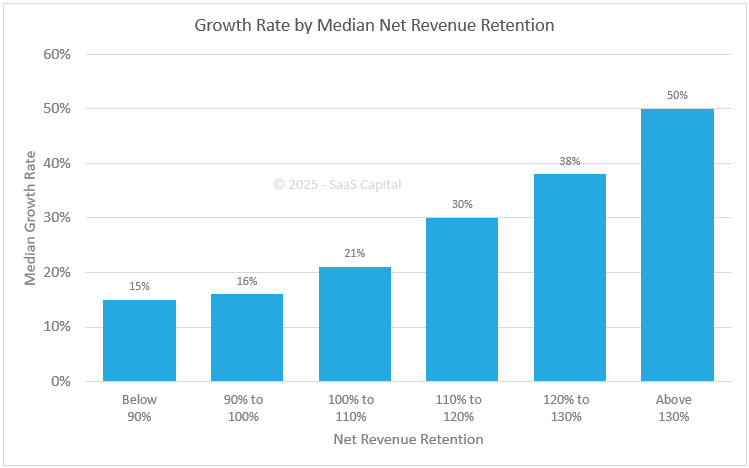
The Impact of Net Revenue on Growth Rates
Generally speaking, higher growth is associated with higher retention and vice versa. This is the “leaky bucket” metaphor. The higher your retention, the easier it is to grow that much faster because you don’t have to first refill the bucket before adding to it. The impact of retention is also cumulative as it repeats and expands on itself year after year. The opposite is also true.
The chart below shows that there is a strong and exponential correlation between net revenue retention and growth. The correlation between growth and NRR is intuitive, as net retention includes what are essentially new “sales” in the form of price increases, upgrades, upsells, and cross-sells, all of which help grow revenue year-over-year. The cumulative compounding nature of NRR is clearly evident.

Across the entire survey sample of companies with more than $1 million in Annual Recurring Revenue (ARR), the median growth rate was 24%. The growth rates for groups of companies with NRR of at least 110% were higher than the population median, and the growth rate for companies with NRR below 100% was lower than the population median.
Additional Retention Data
We explore the data above more robustly in our downloadable Research Brief 2025 SaaS Retention Benchmarks for Private B2B Companies. This PDF includes the charts above as well as additional data points.
![]()