SaaS Valuation Multiples: Understanding the New Normal

This post examines the distribution of SaaS company ARR multiples at various points in time. We find that both the overall spread of the multiples, and the “shape” of that spread, have varied distinctly over time, in ways that correspond to different phases of the industry’s lifecycle. We are able to do this analysis because of the rich historical dataset in the SaaS Capital Index.
The bottom line up front: while SaaS valuations in 2025, on average, have returned to the “low normal” level seen in 2016-2017, today the highs are higher, the lows are lower, and the “long tail” stretches to the right. It’s a “rich get richer” valuation environment, and merely being a SaaS company is no longer a ticket to premium ARR multiples.
Recapping the SCI over time
The SaaS Capital Index (SCI) tracks the median public SaaS company ARR multiple, defined as market capitalization divided by most-recent-quarter annualized revenue. The resulting value is a rough estimate of how investors view the SaaS sector overall. Movement of the SCI also provides a directional guide to what private companies can expect with valuation multiples, though the private multiples are, all else equal, lower.
Because we’ve been curating and publishing the SCI for well over a decade, we are often asked whether the current level of the SCI, which stands at 6.7x as of June, 2025, is relatively “normal,” and whether we expect it to go up or down. Though we focus on the ARR multiple and call it “SCI” for shorthand, there’s a lot more behind that single monthly number. The full underlying data, including history back to inception, is available here.
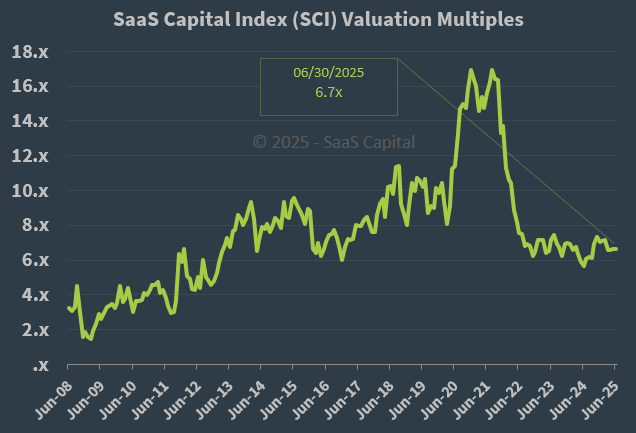
Figure 1: SCI as of June, 2025 (6.7x)
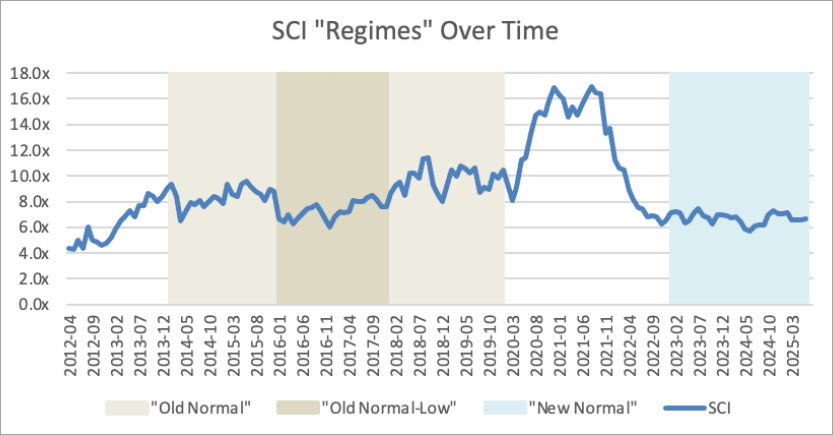
Roughly speaking, we consider there to be four major regimes at work:
A visual check shows us that the 2016-2017 “Low [Old] Normal” period appears to be the most comparable to the environment today in 2025’s “New Normal.” We’ve color-coded bands in the graph below; also, from here forward, we begin our dataset in 2012 because there were too few data points during 2008-2011 to meaningfully analyze their distribution.

The key question that strikes us about this New Normal is: is today’s median of 6-8x equivalent to the “Low Normal” median range of 6-8x ARR, or is it somehow meaningfully different?
Visualizing the Spreads in the SCI
A simple way to start, without needing statistics, is simply to graph the quantiles. Here, we use 25th percentile, 50th percentile (median), and 75th percentile at each month in our dataset. It’s clear to see from the below that variation was least during the “Low Normal” regime, and greatest during the COVID regime.
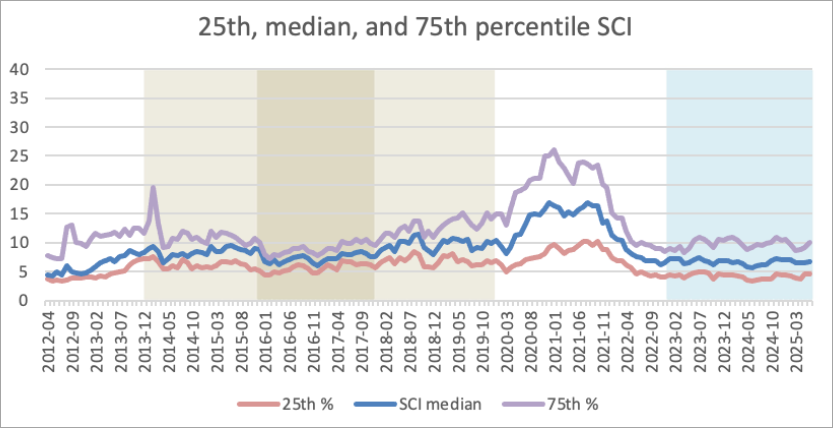
During the 2021 peak, the “rising tide” lifted all boats – but some much more than others. The 25th percentile of valuations were double their normal range (10x ARR vs 5x ARR), but the 75th percentile reached almost 2.5 times their normal range (25x ARR vs 10x ARR).
It’s also instructive to look beyond the 75th percentile to the very highest valuations observed – the 90th percentile, as well:
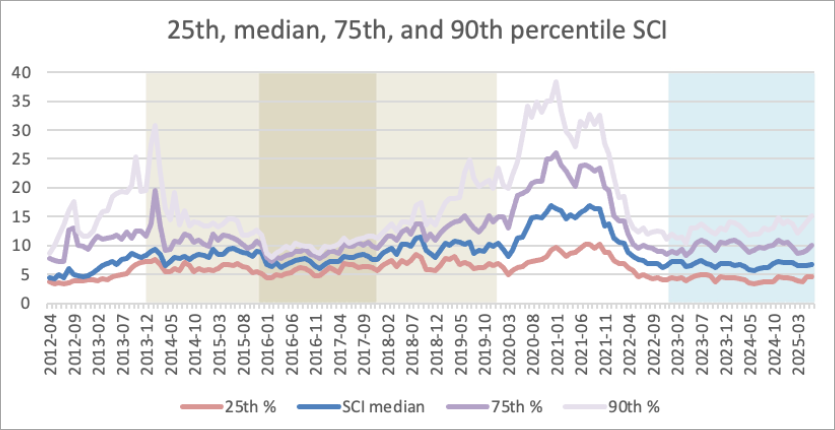
Here we can see that the 90th percentile valuation multiples, which during the Low Normal period were barely higher than the 75th percentile multiples, reached extreme outlier numbers, surpassing 35x at the peak of the COVID period.
And, to a lesser extent, that “superstar” 90th percentile effect persists during the New Normal period today, such that the very highest multiples (90th percentile) observed today are as much higher than the merely very good (75th percentile), as the very good ones are from the median (50th percentile). Conversely, the bottom 25th percentile of laggard SaaS valuations are actually consistently lower than those of their peer percentile during the low normal period.
A succinct way to measure this is the Interquartile Distance (IQD), which is simply the difference between the 75th and 25th percentiles.
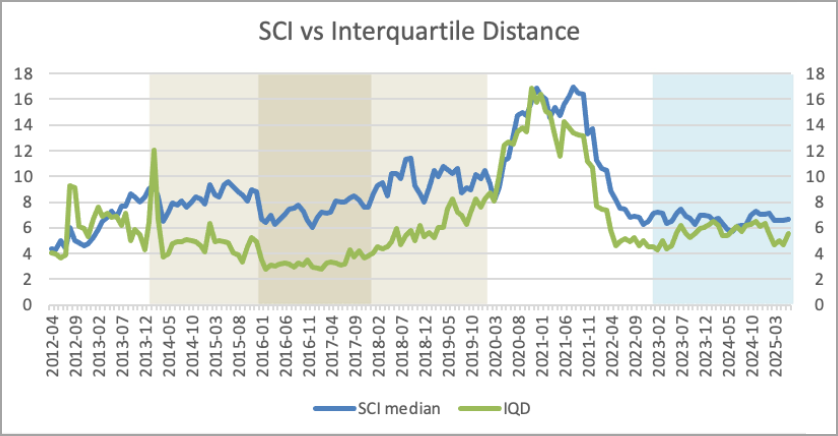
The IQD during Low Normal was around 3.0, meaning that if the median stood at 7.0x, the leaders (75th percentile) tended toward 8.5x, and the laggards (25th percentile) tended toward 5.5x – a pretty tight spread. During the New Normal, the IQD is closer to 6.0, meaning that with a similar median, leaders would be around 10.0x and laggards at 4.0x – a very big difference when applied to $100M+ in ARR.
It’s beyond the scope of this blog post, but it’s interesting to note that the shape of the “bell curve” has also changed over time. During Low Normal, the “long tail” was to the left, with straggling underperformers, whereas today the “long tail” is to the right because the superstars are effectively unbounded to the upside.
Interpreting the Variation of Valuations
The analysis and visualizations above show that the variation among SaaS company valuations today is notably wider than during most of the industry’s history. What does this mean for the industry?
Beyond these primary analytical conclusions, we have a few more editorial observations as well. First and foremost is that there is no reason to expect the current New Normal valuation range to give way to a different valuation environment – and certainly no foregone conclusion that we will someday go back to a world where 8-10x ARR is the norm. Interest rates could change that, but overall, we think New Normal valuations are rational and in line with historical norms.
This post is being finalized right after the debut of Figma in a “blockbuster” IPO, which saw the stock trade above 50x ARR. (We will be adding $FIG to the SCI as part of our regular monthly review of SCI components.) Figma is an object lesson regarding the upside “long tail” in SaaS: there is practically no limit to realized ARR multiples, even in a time when the median hews to a relatively low historical range.
The Figma example can also illuminate a possibly troublesome dynamic in the market for SaaS company financing. A well-diversified growth-stage VC portfolio that includes at least a couple of the eventual superstars will stand to benefit from the highest highs. But the individual SaaS entrepreneur doesn’t hold 20 or 40 “lottery tickets” – she or he holds just one, which is by definition more likely to be close to the median.
As long as the public markets continue to exhibit these conditions, expect VCs to be disproportionately trying to go later-stage and prioritize ensuring that they don’t miss the next Figma – even if that means joining an oversubscribed “party round” at a nosebleed valuation.
These types of risk-aversion logjams in VC often get unclogged when a new hype cycle begins, after a bellwether for a new category is recognized. These new hype cycles get the risk capital flowing back into the pure startup and early-stage companies again. The last five years have seen false starts with AR/VR and Crypto/Web3, and we are now in a “TBD” moment as it regards AI startups. Anecdotally, AI-focused software startups are one of the lone bright spots in terms of attracting early-stage equity on good terms in 2025, but exit data are sparse, much less public company comparable data.
Until this logjam clears, VCs as a category will be under-funding earlier-stage SaaS companies – creating opportunity for aggressive, counter-cyclical equity investors and debt providers. SaaS operators can benefit from this knowledge by taking a clear-eyed approach to raising (or avoiding) equity at sober valuations, and aligning owners’ and teams’ aspirations with reality about what exit multiples are realistic. This can mean a “reset” in expectations, or it can mean a lengthening of the growth period required to make the math work for everyone. However, “hope is not a strategy,” and merely waiting for 2021-era median valuations to return isn’t, either.
![]()