Model your SaaS growth with Scenarios


What would happen if you reduced churn by 20%? Raised prices by 10%? Doubled your free trial volume? With ChartMogul’s new Scenarios feature, you can explore how key business decisions might impact ARR and subscriber count.
What are Scenarios?
SaaS founders and revenue leaders are constantly thinking “what if?”
What if we reduce churn by 2%?What if we raise prices?What if we double down on expansion revenue?
There are endless levers you could pull… but one of the hardest parts of the job is figuring out which ones will actually move the needle.
That’s where Scenarios comes in. It lets you model how changes in churn, pricing, acquisition, and more could impact your future ARR and subscriber count, using your recent performance as the foundation.
Whether you’re pressure-testing growth plans or aligning your team around what’s possible, Scenarios helps you model your SaaS growth.
Here are a few Scenarios you can try:
- You’re considering a price increase and want to see its potential impact on ARR over the next 12 months.
- You’re focused on specific churn improvements and want to understand how a 1-point reduction might help you hit this year’s ARR target.
- You’re reworking onboarding and want to explore how an improvement in conversion might look.
How to model your first Scenario
To get started, head to Scenarios in your ChartMogul account.
Scenarios are based on your historical performance, so to start, select whether to base your projection on the last 3, 6, or 9 months of performance.
Choose from a set of common SaaS growth levers:
- New subscriber volume
- Pricing changes
- Customer churn rate
For each lever, define the change you want to simulate:
- Increase or decrease by a specific percentage
- Apply the change immediately or over a defined period of time
You can mix and match multiple conditions to build out more complex scenarios.
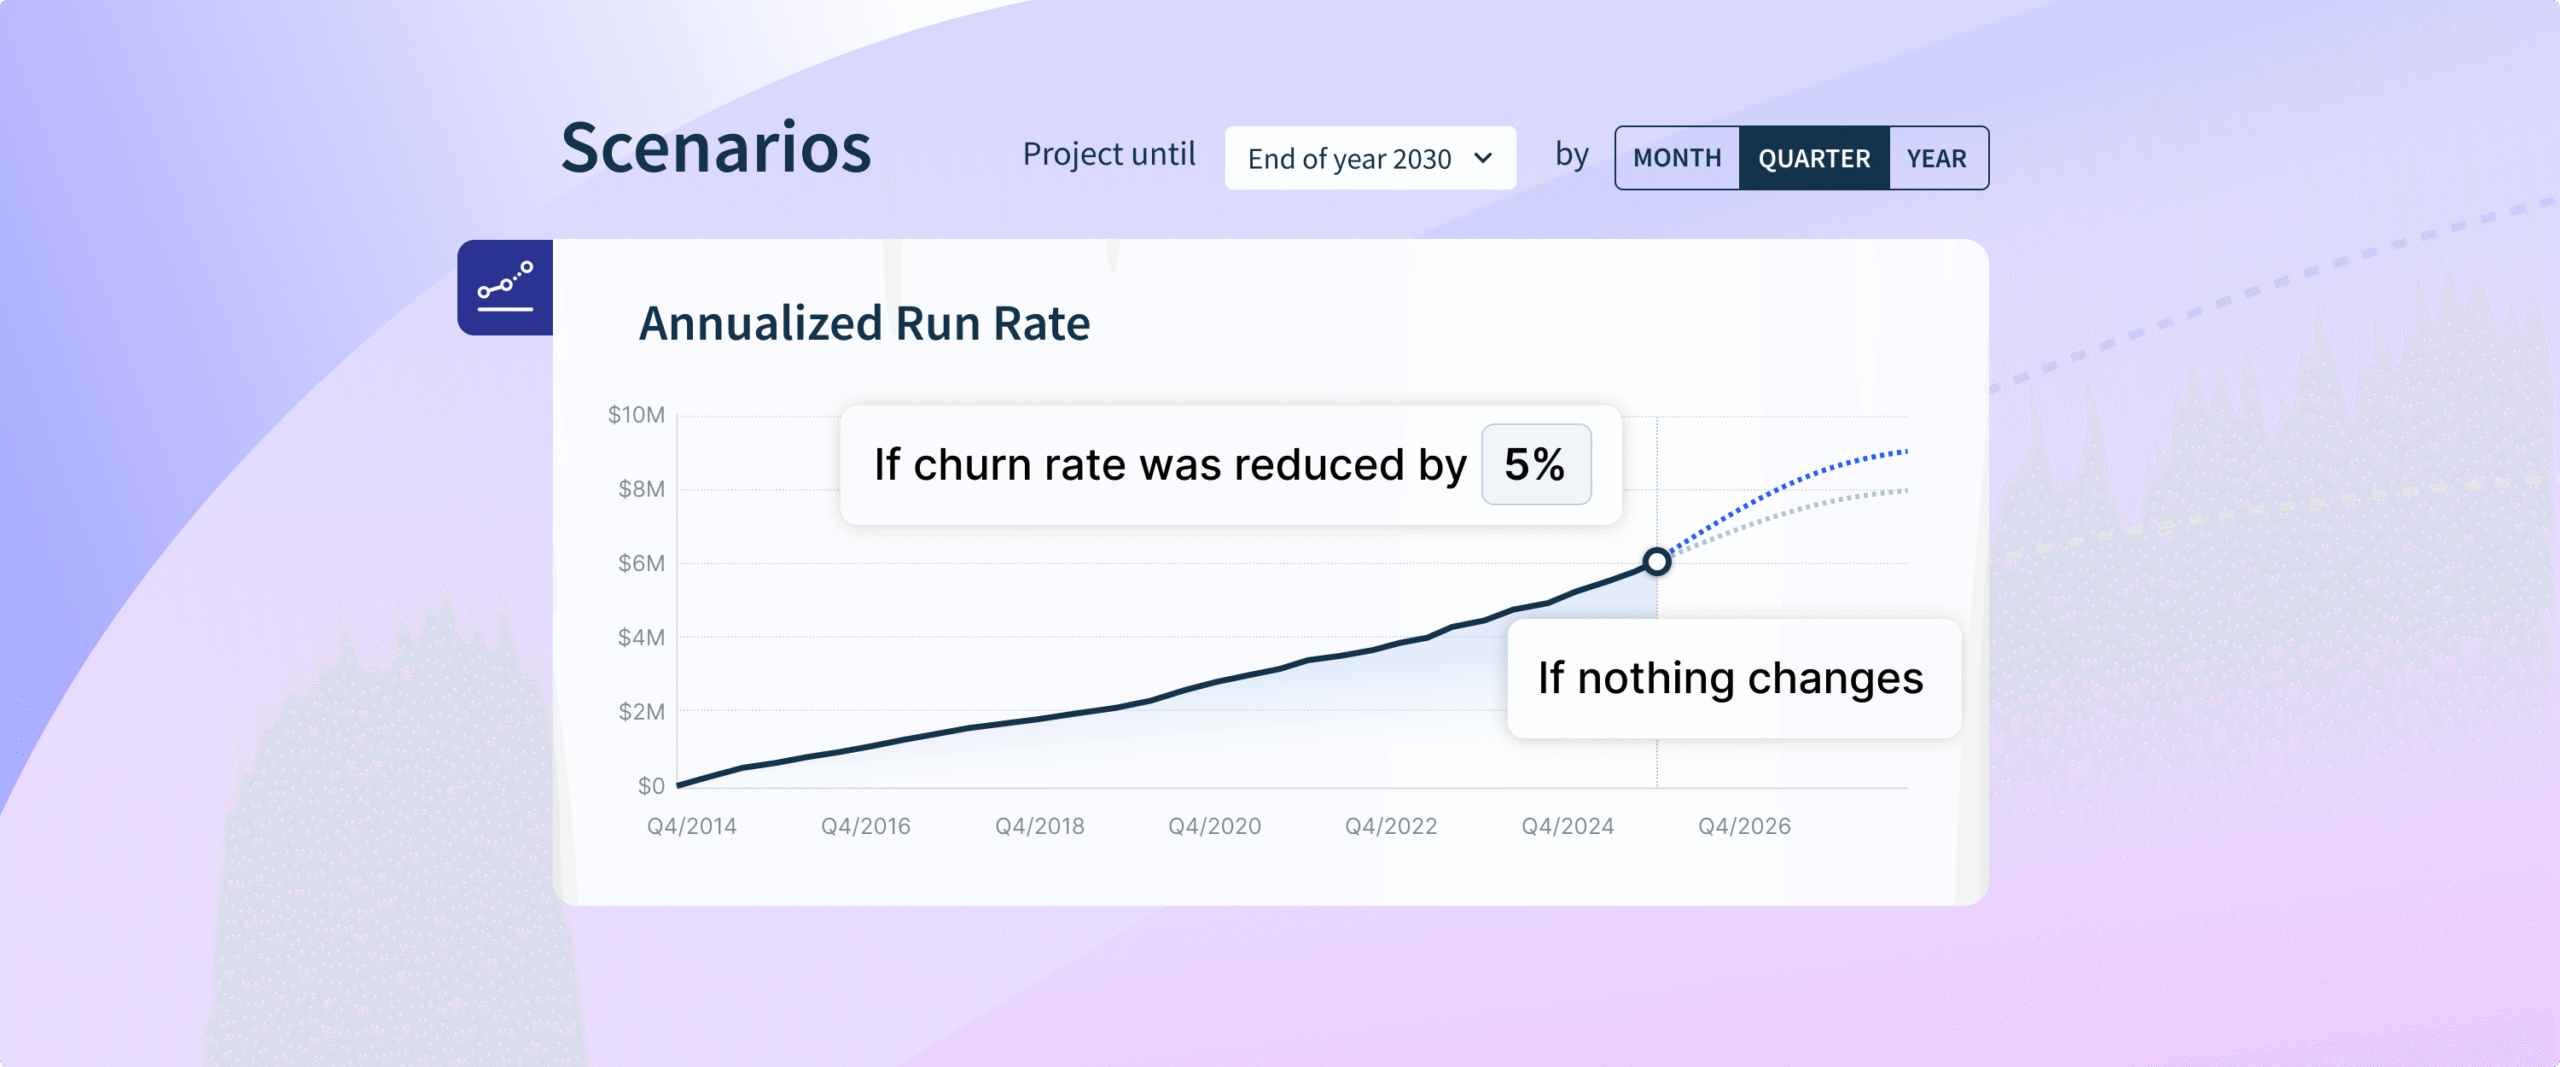
The chart updates dynamically as you adjust inputs. The gray dashed line shows your scenario-based projection. The blue dashed line shows the baseline, based on historical averages
Use Scenarios to visualize potential outcomes month by month, quarter by quarter, or year by year.
Model your SaaS growth today
Whether you’re pressure-testing pricing changes, planning acquisition spend, or modeling retention improvements, Scenarios help you explore what’s possible and rally the team around ambitious targets.
Try it out now.